
Stavros Hatzimarinakis
Department of Tourism Studies, University of Piraeus / Department of Business Administration, Laboratory of Research and Tourism Satellite Account, University of Patras, Greece
Peter Hackl
Department of Statistics and Mathematics, Vienna University of Economics and Business, Austria
ABSTRACT
The tourism industries are considered to be a significant contributor to the Greek economy. Key statistics in this context are the Tourism Direct GVA and GDP, TDGVA and TDGDP for short, respectively, core results in the implementation of TSA Tables. Despite the importance of tourism, the Greek system of tourism statistics does not provide the necessary breakdowns of tourism expenditures as well as of products and activities in the Supply and Use Tables needed to implement the TSA Tables along the international standards and to estimate the contribution of tourism to the economy. For this situation, which is not uncommon in many countries that engage in implementing TSA Tables, the paper uses an innovative approach: statistical models for estimating the necessary data of tourism consumption and supply of tourism-related products and industries, and assumptions that allow estimating TDGVA and TDGDP. Reliable values of the Greek TDGVA and TDGDP, measured along the TSA framework, are available for the first time; they show a rather pleasing picture of Greek tourism, at least for the years up to 2020 when Covid-19 caused a real collapse of tourism: The TDGPD increased from 7.026 to 10.994million Euros, an average annual growth rate of 5,1%, whereas the GDP shows an average annual decrease of 2,2%. The ratio of TDGDP to GDP increased from 3,1% to 6%, presenting an average annual growth rate of 7,5%.
Key Words: Greek tourism, Tourism growth, Tourism direct GDP, TSA Tables
INTRODUCTION
The tourism industries are considered to significantly contribute to the Greek economy. During the period 2011-2019, according to ELSTAT’s business register, accommodation and food services (Section I, NACE Rev.2) concentrate about 9% of the legal units, 4% of turnover and 12% of employment of the total economy; the sector’s average share to total output and GVA is about 6% (SUTs of 2010-2018). A significant part of these indicators is tourism driven.
Despite the significance of tourism, the system of tourism statistics is not very well developed. The main data sources are surveys conducted by the Bank of Greece and ELSTAT. The Bank of Greece provides data on tourism flow and expenditures of inbound tourism. The focus of ELSTAT is on domestic and outbound tourism; ELSTAT also compiles the Supply and Use Tables. Unfortunately, the available breakdowns of the tourism expenditures are limited and require further refinement for estimating a comprehensive expenditure structure; the breakdowns in the Supply and Use Tables do not sufficiently specify the tourism characteristic products and activities.
The EU-funded Structural Reforms Support Service (SRSS) project (Hatzimarinakis and Hackl, 2017) was a major push to the Greek tourism statistics. The project report contains the documentation of available data sources relative to their consistency with TSA-concepts including the identification of data gaps, and recommendations for improvements. It also shows pilot TSA Tables 1 to 6; however, the Tourism Direct GDP could not be estimated based on the available data.
Despite improvements, the tourism database is still not a comprehensive system of tourism statistics that allow implementing Tourism Satellite Account along the international standards. Examples for actual deficiencies are the lack of a complete accommodation directory, the lack of breakdowns in SUTs which specify tourism characteristic products and activities such as passenger transportation, and the lack of detailed demand data for expenditures.
Our paper uses statistical models that allow imputing missing data of tourism consumption and supply of tourism related products and industries, and assumptions corresponding to a methodological approach suggested by UNWTO (2022). This allows estimating the Tourism Direct GVA and GDP. Our results show a rather pleasing picture of Greek tourism, at least for the years up to 2020 when Covid-19 caused a real collapse of tourism not only in Greece but world-wide.
Methodology
A core element of TSA is the TSA Table 6: “Total Domestic Supply and Internal Tourism Consumption” that reconciles supply with demand and provides estimates of Tourism Direct Gross Value Added (TDGVA) and Tourism Direct Gross Domestic Product (TDGDP); see UNWTO (2010). For implementing the table, detailed data on internal tourism expenditures and on the supply of tourism related products are needed. Estimating TDGDP based on a less detailed database is feasible by making certain assumptions; such assumptions may refer to the tourism shares of the supply of industries and the value added contained in these tourism shares. The UNWTO MST report (2022) describes such an approach of estimating the TDGDP based on a rather limited level of detail in the information about tourism related products and industries.
In addition to the lack of details, limitations in the availability of tourism data consist also in incomplete coverage over time. E.g., annual numbers of arrivals and overnights and total expenditures of inbound visitors are available, but not the composition of expenditures over the product categories; a plausible structure was defined under the SRSS project, using detailed data from the Bank of Greece. Such missing data can be estimated using time series models that make use of relations between the missing statistics and indicators like the total tourism expenditures but also economic indicators like the GDP.
A detailed description of our approach, used for supplementing the TSA-relevant database, is provided by Hackl & Hatzimarinakis (2023); all necessary data on tourism expenditures and SUTs for the years before and after the reference year 2015 of the pilot TSA project are imputed with suitable statistical models. Based on these data, the TSA Table 6 is implemented, the supply with internal tourism consumption reconciled and TDGVA and TDGDP calculated. This allows drawing a general picture of Greek tourism and assessing the direct impact of tourism on the Greek economy during the decade 2010 to 2020.
For assessing the results of our analysis, direct statistical quality measures are not available. The wide variety of data sources such as surveys, administrative data and results from accounting procedures does not allow applying standard statistical methods for assessing quality and reliability. Ratings by experts can be used instead as suggested and demonstrated in the Canadian TSA Handbook (Statistics Canada, 2007). In the context of our paper, additional uncertainty comes from estimating missing data and the use of statistical methods and the involved assumptions. A final assessment of the results of our analysis will be possible on the basis of a comprehensive system of tourism statistic that allows the implementation of the TSA Tables along international standards.
Development of Greek tourism
In the fourth round of TSA data collection conducted by EUROSTAT in 2019, 24 of the 28 EU member states provided data; exceptions were Ireland, Cyprus and Luxembourg. Greece was a special case as the pilot TSA Tables implemented by Hatzimarinakis and Hackl (2017) for the reference years 2015 were submitted and included in the EU aggregates but no details were printed in EUROSTAT (2019) as for the other member states.
Results of our present paper show a rather pleasing picture of Greek tourism, at least for the years up to 2020 when Covid-19 caused a collapse of tourism. Figure 1 shows the steady growth of TDGVA and TDGPD as well as the ratios of TDGVA and TDGPD to GVA and GDP, respectively, over the years 2010 through 2019. In this period, the TDGVA grew from 6.131 to 8.798 million Euros, an average annual growth rate of 4,1%; the TDGPD increased from 7.026 to 10.994million Euros, an average annual growth rate of 5,1%. In the same period, the GDP decreases from 224.124 million Euros to 183.351 million Euros, corresponding to an average annual decrease of 2,2%. This shows very well the growing importance of tourism for the economy: The ratio of TDGVA to total GVA raised from 3,1% in 2010 to 5,5% in 2019, i.e., an average annual growth of 6,7%; the ratio of TDGDP to GDP increased from 3,1% to 6%, with an average annual growth rate of 7,5%.
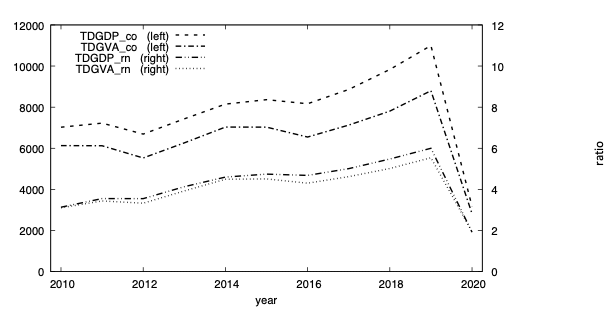
Figure 1: Time series for the years 2010 to 2020 of TDGVA and TDGDP (in million Euros) as well as TDGVA_rn and TDGDP_rn (in %), the ratios of TDGDP to GDP and TDGVA to GVA, respectively.
Table 1 provides the GDP values and the estimated Tourism Direct GDP values as well as the corresponding ratios that are shown in Figure 1.
Table 1: GDP and Tourism Direct GDP, both in million Euros, and the corresponding annual growth rates, as well as TDGDP_rn, the ratio of TDGDP to GDP, in %, for 2010 to 2020
|
Year |
GDP |
ΔGDP |
TDGDP |
ΔTDGDP |
TDGDP_rn |
|
2010 |
224.124 |
7.026 |
|
3,1% |
|
|
2011 |
203.308 |
-9,3% |
7.224 |
2,8% |
3,6% |
|
2012 |
188.381 |
-7,3% |
6.690 |
-7,4% |
3,6% |
|
2013 |
179.884 |
-4,5% |
7.433 |
11,1% |
4,1% |
|
2014 |
177.236 |
-1,5% |
8.149 |
9,6% |
4,6% |
|
2015 |
176.369 |
-0,5% |
8.364 |
2,6% |
4,7% |
|
2016 |
174.494 |
-1,1% |
8.167 |
-2,4% |
4,7% |
|
2017 |
176.903 |
1,4% |
8.861 |
8,5% |
5,0% |
|
2018 |
179.558 |
1,5% |
9.834 |
11,0% |
5,5% |
|
2019 |
183.351 |
2,1% |
10.994 |
11,8% |
6,0% |
|
2020 |
165.406 |
-9,8% |
3.171 |
-71,2% |
1,9% |
Growth rates similar to those of the TDGVA and TDGDP ratios are found for the number of arrivals of inbound visitors, raising from 15,0 millions in 2010 to 34,0 millions in 2019, an average annual growth rate of 9,5%; for the number of overnights of inbound visitors, starting with 140,2 millions and increasing to 236,5 millions, an average annual growth rate of 6%; and for the expenditures of inbound visitors, nearly doubling from 10.593 million Euros in 2010 to 19.960 million Euros in 2019, corresponding to an average growth rate of 7,3% per year. The average annual growth rate of the internal tourism expenditures amounts to 5,3% in this period.
The growth of Greek tourism is also in international terms eminent. OECD (2020) presents annual growth rates of the number of international tourist arrivals in OECD member countries and selected partner economies between 2014 and 2018. The Greek growth rate amounts to 8,0%; among European countries, only Hungary (10,1%), Ireland (8,9%) and Portugal (11,9%) have higher growth rates.
The numbers of arrivals and overnights of inbound visitors for 2020 show a tremendous break to 21,8% and 27,1%, respectively, of the values for 2019. The TDGVA ratio dropped to 1,9% of the Greek GVA, only 35,1% of the 2019 value; the TDGDP ratio was also reduced to 1,9%, only 32,0% of the 2019 value.
Conclusions
As the statistics presented in Section 3 show, Greek tourism was extremely flourishing in the decade 2010-2020. The share of tourism on the national GDP was growing and reached 6%, nearly the double of the 2010 value. This refers to the direct effects and does not take into account the secondary effects of the touristic demand.
The indicators that are presented in this paper were not available so far, mainly due to the lack of data and limitations in the details of TSA-related statistics.
Hackl & Hatzimarinakis (2023) have provided statistical methods and suitable assumptions which allow implementing TSA Table 6 when only a limited database is available. Such a lack of information certainly causes a decrease of accuracy of the results which is difficult to assess. We are looking forward to comparing our results with future updates based on revisions of the Greek tourism data towards a comprehensive system of tourism statistics. It is hoped that ELSTAT, the national provider of official statistics, will be in the situation to publish tourism statistics and SUTs in sufficient detail soon.
REFERENCES
ELSTAT. Business Register. Retrieved from https://www.statistics.gr/en/statistics/-/publication/SBR01/2019
ELSTAT. Supply and Use Tables. Retrieved from https://www.statistics.gr/en/statistics/-/publication/SEL38/-
EUROSTAT (2019), Tourism Satellite Accounts (TSA) in Europe (2019 edition). Retrieved from https://ec.europa.eu/eurostat/web/products-statistical-reports/-/ks-ft-19-007. DOI: 10.2785/78529.
Hackl, P. & Hatzimarinakis, S. (2023), . Statistical Journal of the International Association for Official Statistics (SJIAOS), Vol 39 (1).
Hatzimarinakis, S. & Hackl, P. (2017), General Report on TSA for Greece: Potentials and Needs. Available at: https://www.researchgate.net/publication/321009980_GENERAL_REPORT_ON_TSA_FOR_GREECE_POTENTIALS_AND_NEEDS_A_light_version_of_the_Final_Report_for_users_of_tourism_statistics (accessed 6 June 2022). DOI 10.13140/RG.2.2.13998.66888
OECD (2020), OECD Tourism Trends and Policies. Paris: OECD Publishing.
Statistics Canada (2007), Canadian Tourism Satellite Account Handbook. Ottawa: Statistics Canada, ISBN 0-662-43174-X.
UNWTO (2010). Tourism Satellite Account: Recommended Methodological Framework 2008. New York: United Nations Publications. Retrieved from https://unstats.un.org/unsd/publication/Seriesf/SeriesF_80rev1e.pdf.
UNWTO (2022). Estimating Tourism Direct GDP with limited data, UNWTO, Madrid (online). Retrieved from https://webunwto.s3.eu-west-1.amazonaws.com/s3fs-public/2022-12/Measuring_TDGDP.pdf