
Ecological Footprint Of Ecotourism Packages: The Case Study Of Siwa, Egypt
Jala Morsy
Tourism, Alexandria University, Egypt
Reem Mahmoud
Tourism, Alexandria University, Egypt
Salma Mohyi Eldin
Tourism, Alexandria University, Egypt
Yasmin Elsayeh
Tourism, Alexandria University, Egypt
ABSTRACT
Tourism represents a key economic sector worldwide, constituting great leverage for local economic development but also putting noticeable environmental pressures on local natural resources. Ecotourism may be a viable alternative to mass tourism to minimize impacts on ecosystems, but it needs shared sustainability standards and monitoring tools to evaluate impacts through Ecological Footprint.
The tourism footprint family comprises the tourism ecological footprint (TEF), the tourism carbon footprint (TCF) and the tourism water footprint (TWF). The tourism footprint represents an important tool for quantitatively assessing the impact of tourism activities on the ecosystem of a tourist destination (Wang, Hu, He and Wang, 2017).
This research proposes the use of the Ecological Footprint (EF) as a tool to assess the sustainability of different consumption patterns and to address human choice in daily life. Considering that different kinds of tourism can have different impacts on the environment, there is the need for development of a valuable tool to compare sustainability of different issues related to tourism. In this study, the EF method was fitted to the Egyptian situation and to an assessment of the potential impact of tourism at the local scale, underlining how tourists’ choices could affect the quality of the environment in a tourist destination.
A qualitative method was used which focuses on collecting and analyzing data. Interviews were conducting among domestic tourism staff in travel agencies in Alexandria, further interviews with the employees in the Eco lodges in Siwa. Then, the ecological footprint was used as an environmental accounting tool. In order to evaluate the ecological footprint of ecotourism packaged in Egypt to help the local ecotourism businesses and public authorities understand and address the impact of their ecotourism products while ensuring their high quality.
Key Words: tourism ecological footprint, sustainable tourism, tourist impact; tourism carbon footprint; tourism water footprint
1. INTRODUCTION
Tourism activities, as a part of the human lifestyle and a form of ecological consumption, have a profound impact on ecosystems (such as soil erosion, air and marine pollution, and natural habit loss) in tourist destination areas by appropriating and consuming sightseeing resources, travel facilities (such as roads and airports), and tourism services (such as resorts, restaurants, hotels, marinas, shops, and golf courses). Therefore, the rapid growth in tourism might cause major problems in terms of environmental (Kisi, 2019). However, increasing numbers of researchers, governments and international organizations have been considering the impacts of large-scale tourism industries on the environment in light of the rapid development of the global tourism industry and the burgeoning environmental issues of climate change and water resource scarcity.
Consistent with this focus, many tourism footprint analyses have emerged in recent years, including tourism ecological footprint (TEF) analysis, tourism carbon footprint (TCF) analysis, and tourism water footprint (TWF) analysis, which share the research target of better integrating tourism industry development with the protection of the ecological environment. TEF analysis emphasizes the comprehensive assessment of tourism activities’ impact on the environment, which has the advantage of being a comprehensive evaluation. TCF and TWF analysis emphasize specific evaluations (TCF analysis focuses on the effects of carbon emissions from tourism activities on climate change, and TWF analysis focuses on the effects of water consumption from tourism activities on water resources). Impacts related to tourism activities can be divided into two main categories (Sala, 2008):
1.1 Impacts due to the building of hospitality structures and tourism facilities.
The first class consists of all impacts due to the building of hotels, restaurants, camping sites and tourist facilities, which can be summarized as: loss of soil previously used for agriculture, pasture or other activities; the necessity to build new roads to connect new tourist structures or to improve and enlarge existing roads to make them adequate for an increased level of traffic. It is important to consider that this kind of impact is persistent, because tourist structures, often scaled for the wider tourist flow of the destination, stay in the territory, even if they are almost empty during the whole year
1.2 Impacts due to the presence of tourists and, generally, to the fruition of the area.
The presence of tourists can generate two main kinds of problems: the production of solid and liquid wastes (that imply a cost for the disposal which is paid by the local community and needs the organization of a service of collection dimensioned with reference to the maximum volume generated during the year, i.e. in the tourist season); the possibility of conflict between residents and tourists in the use of local resources and services (use of drinkable water and treatment of wastewater, air pollution, noise pollution, traffic, crowding, etc.)
Thence, to assure sustainable development of the tourism sector, it is important that the planning of tourism offered to a destination is based on a robust analysis of environmental, social and economic conditions of the area and of the current and potential impact of tourist activities, in comparison with the carrying capacity of the destination. According to this purpose, the assessment of the EF of tourists and of the bio capacity of the area represent an attempt to provide a supporting tool to decision makers, with the aim of addressing tourism strategies for the future development of the destination in a more sustainable way. Moreover, the aim of the present study is to analyze the impact of tourism on a destination, and to compare the sustainability of different kinds of holiday, to evaluate the current situation, and to identify solutions that assure the development of tourism with fewer environmental costs.
2. Literature review
2.1 The concept of Ecological footprint
Often considered a primary focus of sustainable development, the reduction in resource use and environmental degradation is key to the preservation of natural capital. Integral to this goal is a system of measuring the draw of human activity on the environment (Ayers, 1996). Therefore, Ecological Footprint has emerged as one of the more tested and implemented methods of ecological resource accounting. The ecological footprint was first discussed by Rees (1992). Wackernagel and Rees (1996) defined the ecological footprint as “the total area of productive land and aquatic ecosystems required to produce the resources used and to assimilate the wastes produced, by a defined population at a specified material standard of living, wherever on Earth that land may be located”.
The Ecological Footprint is a measure that aggregates data to compare the resource use of one lifestyle versus another (Wackernagel and Rees, 1996). Simply put “Ecological Footprint analysis is an accounting tool that enables us to estimate the resource consumption and waste assimilation requirements of a defined human population or economy in terms of a corresponding productive land area” (Wackernagel and Rees, 1996, p.9)
Some other scholars also defined the ecological footprint. For example, Global Footprint Network (2019) defined the ecological footprint as “a measure of how much area of biologically productive land and water an individual, population or activity requires to produce all the resources it consumes and to absorb the waste it generates, using prevailing technology and resource management practices.” Therefore, the ecological footprint is a more comprehensive measure of environmental damage (Mrabet et al., 2016) .
The footprint of humanity (average 2.3 hectares per person) is not evenly distributed throughout the globe. When one looks at the Ecological Footprint on a country-by-country basis, severe disparity is evident. For example, the Canadian footprint is estimated at 8.8 ha/person, the Costa Rican footprint at 1.95 ha/person, and the Indian footprint at 0.77 ha/person (Wackernagel et al, 1999, World Wildlife Fund, 2002). This simple comparison immediately gives an idea of the level of resources consumed by citizens of different countries, with a wide range of lifestyles. The essential message of the EF is that “A world upon which everyone imposed an over-sized Ecological Footprint would not be sustainable-the EF of humanity as a whole must be smaller than the ecologically productive portion of the planet’s surface” (Wackernagel and Rees, 1996, p.9). Hence, the EF seeks to apply limits to the levels of human resource use, based upon a balance between consumption, waste assimilation, and available land to support these activities. As a way of promoting an equal quality of life for all (Wackernagel and Rees, 1996).
The Ecological Footprint is about staking claim to the earth’s resources in an equitable manner. Some citizens of the world have over-sized footprints and others are dramatically undersized, so much so that survival is questionable. The equalization of resource use, while maintaining a respectable quality of life is one primary goal of sustainable development (Wackernagel and Rees, 1996). The EF concept then is an indicator of current-state sustainability placing all humans within a common scale. In this way, the EF not only raises awareness of currently unsustainable behavior, but also highlights where action could be taken (Wackernagel and Rees,1996; Costanza, 2000). “Ecological footprints can become an easy-to-read measurement tool for ecological sustainability, by summarizing the diverse ecological impacts in an ecologically meaningful way (Wackernagel et al., 1999).
2.2 The Tourism Ecological Footprint
Recent academic articles have called for investigation into the use of the Ecological Footprint as a tool to compare the sustainability of various types of tourism (Hunter, 2002). The ultimate goal of such an exercise would be to establish a measure of what is and what is not sustainable tourism. Supporting this idea is the work of Wackernagel & Yount (2000) who suggest the use of the Ecological Footprint to assist decision makers in identifying sustainable options. This idea is expanded by Hunter (2002), who makes a case for the use of the Ecological Footprint to clarify the status of sustainable tourism.
The application of the Ecological Footprint concept to the study of tourism has been explored by a very small number of researchers in recent years (Hunter, 2002; Cole and Sinclair, 2002; World Wildlife Fund, 2002).
Two of the more widely available examples include The World Wildlife Fund’s “Holiday Foot printing: A Practical Tool for Responsible Tourism” (2002), and Cole and Sinclair’s “Measuring the Ecological Footprint of a Himalayan Tourist Centre” (2002). Each work uses the Ecological Footprint model to compare different aspects of the tourism experience. The World Wildlife Fund example looks at the specific resource use of two different resorts, one in Majorca, and the other in Cyprus. These two package holidays are analyzed to provide an initial measure of the ecological cost of Mediterranean resorts. Cole and Sinclair use the Ecological Footprint to measure the change in resource use overtime for the village of Manali, in the Himalayan region of India.
2.3 Benefits and Limitations of the Ecological footprint
The ecological footprint has recently been proposed as a key indicator for measuring the environmental impacts of tourism (Hunter and Shaw, 2007). Unlike other locally-based measures, such as carrying capacity or environmental impact assessments, the ecological footprint takes into account the consequences of transit as it relates to tourism. In addition, this tool indicates the global impacts of activity and expresses resource demands in standardized hectares to facilitate understanding (Hunter and Shaw, 2007). As a result of these characteristics, Wackernagel and Yount (2000) were able to use the EF tool to prove that current levels of global resource consumption and waste generation were greater than the biosphere’s biotically productive area. In addition, they could estimate from the EF indicator the amount of extra land that would be needed to satisfy current consumption levels. In a tourism context, Wackernagel and Yount (2000) were also able to determine that at least 10% of the world’s ecological footprint was occupied by the tourism industry’s international component. Furthermore, the WWF (2006) used the EF tool to determine that the world ecological footprint in 2003 exceeded available supplies by 25%, indicating that the needed resources for 2003 were only fully produced by the earth in March of 2004.
Unlike other indicators, the EF does not assume that ecological productivity can be continually replaced with technological advances, therefore it highlights the issues that could arise when substitutes are no longer available (Senbel et al,. 2003). Furthermore, the EF can be calculated for specific components of a lifestyle, for entire nations or for business activities, and is therefore a flexible and versatile indicator (Holland, 2003; Hunter and Shaw, 2007).
Concerning limitations, the largest weakness of the EF as a sustainability indicator is its inability to measure socio-economic factors, resulting in its need to be combined with other indicators in order to determine the overall sustainability of a lifestyle or activity (Hunter and Shaw, 2007). Furthermore, EF calculations require detailed information on consumption and biomass yield figures, which can be difficult to obtain when statistical databases are incomplete. In addition, current EF calculations cannot provide a realistic view of biodiversity loss (Wackernagel and Yount, 2000).
Clearly, although carrying a number of positive features, the limitations surrounding the ecological footprint enable it to only provide a rough indication of sustainability levels. These limitations appear to be well known and accepted by ecological footprint advocates. Rees (2000 p. 373) for instance states that “ecological footprint analysis was not intended to provide a dynamic window on the future, but rather a snapshot in time. As such it can both help to assess current reality and to test alternative scenarios on the road to sustainability”.
2.4 Calculating the Ecological Footprint of Ecotourism Packages
The Ecological Footprint is an environmental accounting tool to track the human pressure on nature’s capacity to provide life-supporting resources and sequester human wastes (Wackernagel and Rees, 1996; Wackernagel et al., 1999). Since its introduction, the Ecological Footprint methodology has been developed and standardized to build a robust accounting framework able to measure both the human appropriation (demand side) and the natural provision of (supply side) (Borucke et al., 2013; Kitzes et al.,2009). The established accounting framework is based on two fundamental metrics:
- Ecological Footprint (EF), measuring the demand side. This demand is measured in terms of biologically productive areas that humans and activities required for producing all the resources consumed and absorbing all waste produced.
- Biocapacity (BC), measuring the supply side. This supply is measured as the amount of biologically productive land and sea area available to provide the resources and ecosystem services that humanity consumes. It is also called nature’s regenerative capacity.
Moreover, the Ecotourism Footprint Calculator is one of the final deliverables of the DestiMED project funded by the EU InterreMED Program (2016-2019). The project involved 13 Protected Areas (PAs) in 6 Mediterranean countries (Albania, Croatia, France, Greece, Italy, Spain) to create ecotourism experiences grounded on tangible sustainability criteria and standards. As pilot cases, 13 ecotourism products (one in each PA) were designed by Local Ecotourism Clusters (LECs) created as part of the project and consisting of local tourism actors and service providers; these products were then tested for their economic, social and cultural sustainability – through a quality assessment – as well as their impact on the use of natural resources (i.e., their environmental sustainability). This latter evaluation was performed by Global Footprint Network through a novel application of Ecological Footprint Accounting, which has been specifically customized to keep track of the resource consumption of ecotourism products (Mancini et al., 2018). Based on such customized methodology, this Ecotourism Footprint Calculator was developed by FreeRange, under the supervision of Global Footprint Network, IUCN, and WWF Adria.
Assessing Ecotourism Footprint packages are through one introductive section and four main sections corresponding to major macro-categories of tourism services offered within an ecotourism package (see also Figure 1).
Introductive section: this section collects general information on the Protected Area where the ecotourism product is conceived, as well as details of the specific product being calculated (name of the package, length, and a number of participants).
2.4.1Accommodation category: this section inquires about all the hosting facilities involved in the package that are used to accommodate tourists. For each hosting facility, questions deal with general information on the type of hosting facility and its characteristics, energy consumption (including electricity, heating and cooling system, hot water production, and water consumption), and the goods and services provided. All questions are mandatory and most require detailed research in collaboration with the hotel’s manager for acquiring the precise data needed. If multiple accommodations are used throughout the package, this section must be compiled for each of them.
2.4.2 Food & Drinks category: this section inquires about the meals envisioned in the eco-tourism package, including breakfast, lunch, dinner, and other types of food-related activities (i.e. food/wine tasting, tea/coffee breaks, snacks, etc). Per each meal that is offered day by day, questions inquire into the origin, mode of production, and quantity of all food items served to the entire group of tourists. Also, some questions deal with the type of stove used, food preparation time, and the number of workers needed. Each question is mandatory. Collecting accurate data requires collaborating with the persons involved in the meal preparation.
2.4.3 Mobility & Transfer category: this section inquires about different types of transfers envisioned throughout the package for tourists to move from one place to another, as well as any kind of equipment or food delivery to the group of tourists. Per every single transfer done each day, questions regard the mode of transportation, duration, and characteristics of any motor vehicle used. Each question is mandatory and requires careful data collection with the service provider hired for each transfer
2.4.4 Activities & Service category: this section inquires about all the services and activities envisioned in the ecotourism product (i.e. excursions, visits, PA-related activities, birdwatching, kayaking, snorkeling/scuba diving, hiking etc.). For each activity, questions investigate its type, duration, number of needed workers/guides, and specifics of vehicles used. Each question is mandatory and requires careful data collection with the service provider in charge of each activity.
Figure 1 shows the four categories of main activities envisioned in an ecotourism package and the main parameters and data needed to assess the Ecological Footprint for each of the four categories.
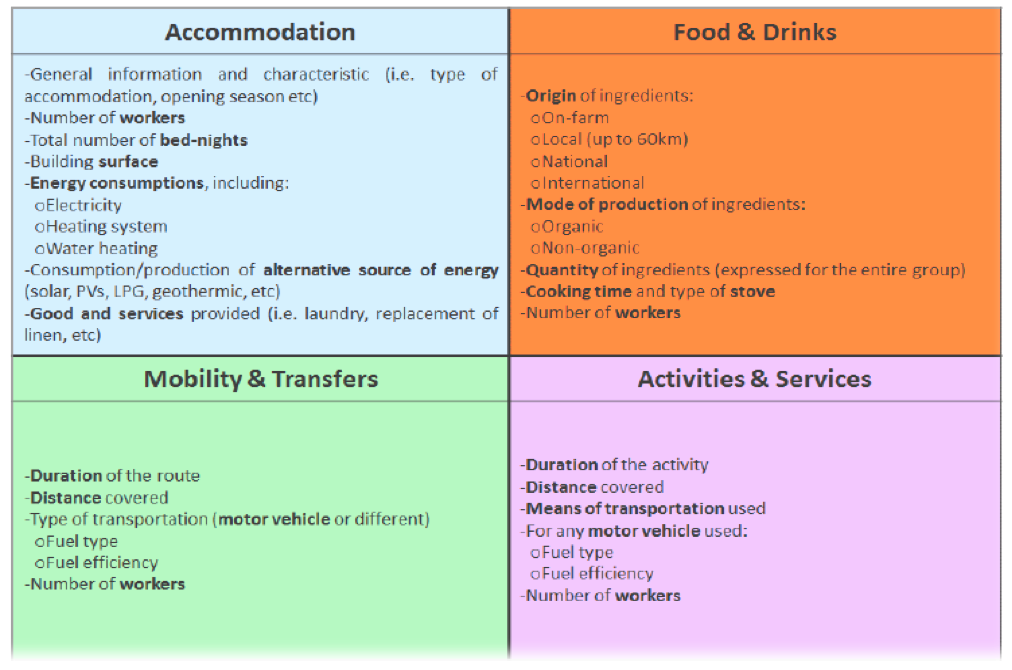
Figure (1): Main categories in an ecotourism package and related parameters required to properly assess the Ecological Footprint
2.5 Area of study: Siwa as an eco-tourism destination (Alhaddad etal.,2017)
Siwa Oasis as an ecotourism destination. The five major oases (Baharia, Farafra, Dakhla, Kharga and Siwa) in the Egyptian desert; are a depression in a calcareous sandy plateau with many springs that are fed from the deep underground water. Siwa is the most fascinating of all the oases, not only for its history, but because of its natural beauty and its people's culture and traditions. Siwa had been known by a host of names through the centuries; Field of Palm Trees and Olive Land. Siwa Oasis is located in the extreme western part between Qattara Depression and Great Sand Sea, closer to Libyan Desert, 300 km South West of Marsa Matrouh, and 800 km of Cairo.
Potentials of ecotourism in the Siwa Oasis Ecotourism development in certain areas in Egypt cannot be ignored. Eco tourists now can enjoy its stunning desert landscapes, hot and cold springs, as well as its unique history and culture. Besides, Siwan people themselves, who preserve their own traditions and language over centuries. Siwa has many traditional attractions which focus on the oasis’ charming landscape; its lakes, bird habitats, and desert areas, fossil remains of great world importance, varied cultural heritage sites reflects a great civilization through ages and its environmental nature, distinctive culture.
Therefore, Siwa was chosen as an eco-tourism destination to calculate the ecological footprint, highlight the weaknesses facing in Siwa, and determine the levels of sustainability in Siwa as an eco-tourism destination.
3. Methodology:
This study has followed two steps, the first step is used qualitative approach and second step is used the ecological footprint accounting.
Qualitative approach often involves the views or internal worlds of participants, and may include data generated through the use of interviews, focus groups, etc. Qualitative research often gathers data from relatively small samples of people, and can provide a ‘micro’ view of whatever issues you are examining (Bakker et al., 2002).
There are three types of interview are structured interviews, the interviewer asks a set of standard, predetermined questions about particular topics, then Semi-structured interviews, the interviewer uses a set of predetermined questions and the respondents answer in their own words based on these answers, ask supplementary questions for clarification, finally Unstructured interviews, the interviewer has no specific guidelines, predetermined questions, or list of options (Bakker et al., 2002).
The purpose of this form of research that combination of qualitative method develop analysis in order to provide richer data and enable confirmation of each other through triangulation (Johnson et al., 2007).
Firstly, conducting interviews with domestic tourism staff in travel agencies, further interviews with the employees in the Eco lodges in Siwa. Secondly data collected through personal interviews, are unloaded through the ecological footprint is used as an environmental accounting tool. In order to evaluate the ecological footprint of ecotourism packaged in Egypt to help the local ecotourism businesses and public authorities understand and address the impact of their ecotourism products while ensuring their high quality.
3.1 Research design
The research design refers to the overall strategy that you choose to integrate the different components of the study in a coherent and logical way, thereby, ensuring you will effectively address the research problem; it constitutes the blueprint for the collection, measurement, and analysis of data. The research problem determines the type of design you should use, not the other way around (De Vaus, 2006).
This study utilizes a qualitative approach in order to evaluate the ecological footprint of ecotourism packaged in Egypt to help the local ecotourism businesses and public authorities understand and address the impact of their ecotourism products while ensuring their high quality.
3.2 Research sample
The sample method involves taking a representative selection of the population and using the data collected as research information. A sample is a “subgroup of a population” (Frey et al., 2000, P.125).
Sampling is the process of selecting units (e.g., people, organizations) from a population of interest so that by studying the sample, we may fairly generalize our results back to the population from which they were chosen (Latham, 2007).
The study was limited to two cities, Alexandria, Siwa Oasis. Siwa is characterized by ecotourism and natural landscapes The number of travel agencies in Alexandria is 349 travel agencies (Egyptian phone directory has been used in collecting data). The sample represented in (4) online interviews that were conducted with domestic tourism staff in travel agencies in Alexandria in May 2021. In addition, the number of hotels and lodges in Siwa is 37 hotels. The sample represented in (4) telephone interviews were conducted with the employees in Eco lodge in Siwa.
3.3 Data collection tools
The interview was used as a data collection tool. According to McNamara (1999) said that “Interviews are particularly useful for getting the story behind a participant’s experience. The interviewer can pursue in-depth information around the topic”.
Bakker et al. (2002) defined structured interviews as “Any enhancement of the interview that is intended to increase psychometric properties by increasing standardization or otherwise assisting the interviewer in determining what questions to ask or how to evaluate responses.” Accordingly, this study has been followed the semi-structured interview as a data collection tool.
3.3.1 Interviews design
3.3.1.1 Interviews with domestic tourism staff in travel agencies
The interview includes 7 questions (appendix 1) divided into three parts: the first part consists of 2 questions, investigate Details of the itinerary to siwa, the second part consists of 3 questions, details of the type of accommodation and the third part consists of 2 questions, details of the ecotourism package.
3.3.1.2. interviews with the employees in the Eco lodges in Siwa
The interview includes 23 questions (appendix 2) divided into four parts: the first part consists of 6 questions, investigate Details of accommodation to Siwa, the second part consists of 5 questions, to measure the food and drink in hotels and restaurants, the third part consists of 6 questions, to measure all experiences included in the eco-tourism package and fourth part consists of 6 questions to measure the mobility and transfer.
4. Data Analysis
4.1 Interviews with domestic tourism staff in travel agencies
Interviews were conducted among 4 travel agencies with domestic tourism staff who were regarded due to their experience and organizational structure. Experience years’ rate as follows: less than 5 years and from 5-10 years.
Table (1): Experience years of work
|
No |
Name of travel agency |
Experience year |
|
1 |
Friends tours |
5 to 10 years |
|
2 |
Sondos tours |
Less than 5 years |
|
3 |
Go trips |
Less than 5 years |
|
4 |
Damas travel |
5 to 10 years |
4.2 Interviews with the employees in the Eco lodges in Siwa
Table (2): Name of the eco lodges in Siwa
|
No |
Name of eco lodge |
Stars |
|
1 |
Dream lodge |
3 stars |
|
2 |
Galliet eco lodge |
4 stars |
|
3 |
Konoz shali lodge |
3 stars |
|
4 |
Siwa gardens lodge |
4 stars |
5. Results and Discussion
The main results obtained from the online footprint calculator of ecotourism packages of Siwa oasis in Egypt are as displayed in the following table:
Table (3): Ecological footprint of ecotourism packages o Siwa
|
The ecological footprint of the whole ecotourism packages |
12.14 gha (global hectare) |
|
|
Percentage (%) |
|
|
Cropland |
11 % |
|
|
Grazing |
3 % |
|
|
Forests |
6 % |
|
|
Fishing |
1 % |
|
|
Built-up |
6 % |
|
|
Carbon |
74 % |
|
|
Percentage (%) |
|
|
Accommodation |
96 % |
|
|
Food and Drink |
3 % |
|
|
Mobility and Transfers |
1 % |
|
|
Activities and Services |
0 % |
|
|
The ecotourism footprint per tourist per day |
22022.4 gm2 (square gigameter) |
|
Ecological footprint is a key indicator with which to evaluate the environmental impact of tourism for conservation issues, resources consumption, and sustainable practices. In siwa the EF of ecotourism packages scored 12.14 gha (global hectare) as shown in table (1). The highest EF ever scored was 16 and the lower number scored is better. Therefore, 12.14 gha means that ecotourism packages to siwa have a big negative ecological footprint on the environment.
According to the EF calculator, it is noted that the carbon is the biggest part of the ecological foot print and accounts 74 % of total ecological footprint of ecotourism packages to Siwa while the rest of EF on other types of land is minor as shown in figure (2). Carbon footprint is the amount of carbon dioxide released into the atmosphere as a result of human activities'. CF is also the biggest part of the world EF and it is the main cause of global warming issues. It is emitted from the burning of fossil fuels, the production and consumption of food, manufacturing goods, materials, wood, roads, building, transportation and other services. In the case of Siwa, carbon footprint might be high because of some bad practices in ecotourism whether from the supply side or demand side. Siwa mainly depend on non-renewable sources of energy and fossil fuel generated electricity from the national grid system. Another reason is their dependence on gasoline old model vehicles that generates huge amounts of carbon pollution. Therefore, it is necessary to set some solutions to reduce the amount of ecotourism carbon footprint on the environment of Siwa.
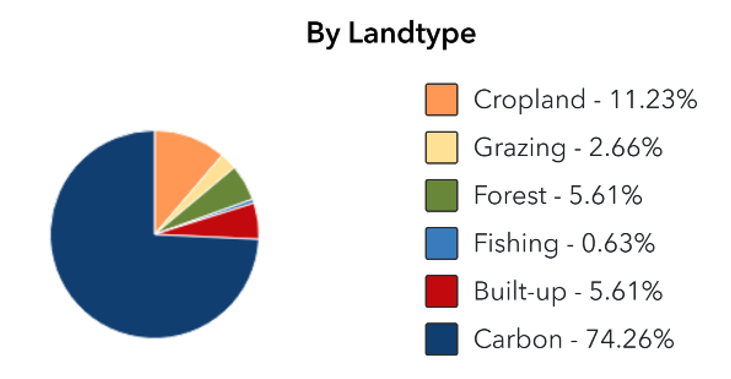
Figure (2): Ecological footprint of ecotourism packages by land
5.1 Accommodation
The most ecotourism activity that has a great impact on the ecological footprint of siwa is accommodation with nearly 96% of the total ecological footprint of the whole ecotourism packages as shown in figure (3). This category is about all the hosting facilities included in the package to accommodate tourists including general information and characteristics of the accommodation facility, number of workers, total number of bed-nights, energy consumptions including electricity, heating system, water heating, A/C, any alternative sources of energy and finally goods and services provided such as laundry, replacement of linen and etc. This high percentage is so much contradicted with the shape and nature of accommodation facilities in siwa, which mostly take the form of environmentally friendly ecologies. Thus, this gives an indication that not all the practices in these ecolodges are 100% eco-friendly as most of the ecolodges in the sample are not certified internationally or nationally with green labels to ensure the level of conveniency and suitability of their practices to the environment. Most of ecolodges in the sample don't depend on renewable sources of energy. They don't apply effective techniques and technologies to reduce energy consumption. Most of them don’t have the infrastructure needed to apply water recycling and conservation strategies.
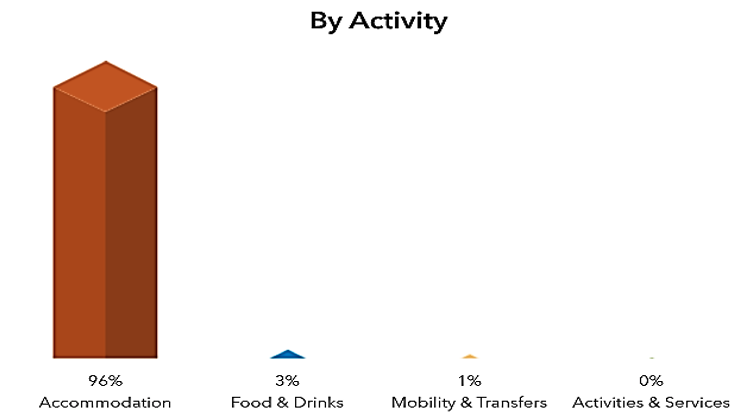
Figure (3): Ecological footprint of ecotourism packages by activity
5.2 Food and Drink:
As mentioned previously, this category is about the main meals envisioned in the ecotourism package, including each meal menu, origin of ingredients, food quantity, cooking time, type of stove and number of workers. As viewed in the previous figure, food and drink account only 3% of the total ecological footprint of ecotourism packages of Siwa. This is relatively small footprint but this might be back to two main reasons. Firstly, most of the food consumed by tourists are not produced in the oasis but transported from other cities. Secondly, in food preparation process, gas stove/ovens and burned cool/wood are mainly used in preparing food.
5.3 Mobility and Transfers:
This Category is about all mobility and transfer services needed to transfer tourists from one place to another including duration, distance, type of transportation, fuel type, and fuel efficiency. Mobility and Transfer accounts only 1 % of the total ecological footprint of ecotourism packages of Siwa. This minor footprint may back to the fact that all transfers in all ecotourism package are short in distance and this 1% effect might be due to their dependence of gasoline old-model vehicles with low gas efficiency rate.
5.4 Activities and Services:
This category is about all the experiences included in the ecotourism packages and offered to tourists including duration of each activity, distance covered, motor vehicle used and number of workers. In Siwa, ecotourism packages' activities and services don't have any ecological footprint on Siwa's environment. That is because nearly all the activities are nature-based and ecofriendly such as hot/cold/sand bathing, watching sunset and sunrise, Salt Lake bathing and sand skiing.
6. Conclusion and Recommendation:
This study contributes to clarifying the role of the ecological footprint in maintaining biodiversity by providing information on human pressure on the environmental assets of the earth. The aim of the research is to use the ecological footprint as an environmental indicator that sheds light on the environmental problems facing the tourist destination, as it is considered an indicator of the levels of sustainability.
In order to achieve a low ecological footprint of ecotourism packages of Siwa oasis, the following recommendations should be followed: Local authorities of Siwa should encourage their Eco lodges to get certified internationally with different green labels. Tourism local authorities should increase the awareness of tour operators and different service suppliers with the concept of ecological footprint and encourage them to calculate their footprint on the destination to reduce it.
Travel agencies as well as tourists should choose to stay in small-scale, family-run, local Eco lodges, preferably with renewable energy sources in place. Travel agencies should encourage the slow travel trend by using alternative and motor-free modes of transportation as much as possible. Walking, as well as using bikes, horses, electric vehicles or even public transit, is preferred to reduce carbon footprint.
Hotels should conserve water by choosing drought-tolerant plants, in addition to using reclaimed wastewater to irrigate landscapes and trees in hotels. Also, it should Water management and treatment for consumption. In addition, integrating energy saving devices into hotel rooms. Increase energy efficiency and energy saving and also increase the role of renewable energy from total energy use to reduce carbon footprint of energy. Siwa's location in the sunny western desert qualifies it to use solar system instead of depending on fossil fuel generated electricity from the national grid system. As for food and drink, Hotel restaurants and other meal suppliers should depend on local and organic food ingredients and products in preparing meals to tourists. Eco lodges should provide the infrastructure needed to recycle wastes instead of dumbing it in the desert. Also, it should reuse of glass, plastic and paper from hotel waste for recycling purposes.
Utilizing these policies can help Siwa to reduce the environmental pressure induced by the tourism sector to make it more sustainable. Moreover, conducting programs for tourists to increase their environmental awareness is essential. Furthermore, it is also important to implement ecological footprint and energy conservation taxes on the tourism sector to reduce the environmental pressure produced by tourism. Lastly, providing a system that stimulates the behavior of tourists through the ecological footprint, as it can be an effective tool to stimulate the behavior of environmentally friendly tourists in order to track the consumption of resources by tourists.
Ecological footprint methodology application could be useful to understanding the impact of several kinds of human pressure and their capability to be “sustained” by a territory. The assessment of tourism impacts done through the evaluation of the EF of a tourist destination involves three categories of subjects: tourists, tourism operators and local administrators. this study focuses on tourism operators who act to make tourism structures more ecologically efficient, reducing impacts due to energy and water consumption, production of waste, etc. Future research should examine the evaluation of the EF of a tourist destination through the role of public administrators who are involved in the definition of land use planning and can influence the whole tourism system, promoting communication campaigns to raise environmental consciousness among residents, tourism operators and tourists, and supporting the development of the destination from a sustainable perspective.
1.1Tables and Figures
Tables and figures should be referred to and included in the text. Each table, figure and illustration should be numbered consecutively (in Arabic numbers) and titled. Tables, figures and illustrations should be kept to a minimum. Figure captions and table headings should be sufficient to explain the figure or table without needing to refer to the text. Headings and captions styles for tables and figures are available in this template. The following is the example for Table 1.
Table 1 Title of Example Table
|
|
CFI |
TLI |
RMSEA |
|
Single common factor model |
0.772 |
0.744 |
0.104 |
|
Two-factor model |
0.886 |
0.893 |
0.060 |
|
Six-factor model |
0.811 |
0.787 |
0.106 |
|
Revised five-factor model |
0.954 |
0.943 |
0.042 |
Tables and figures should be placed close after their first reference in the text. Table headings should be centred above the tables. Figure captions should be centred below the figures, maximum figure size is 6cm×7cm (72dpi).
Figure 1: Title of Example Figure
References
- Alhaddad, A& Ibrahim,O & Lotaif, H. (2017).The Potential of Ecotourism in Siwa Oasis: Opportunities and Obstacles. International Journal of Heritage, Tourism and Hospitality Vol.11, No. 1
- Ayers, R.U. (1996), Statistical Measures of Unsustainability. Ecological Economics 16:239-255.
- Bakker,P & Zee,KL (2002). Why Are Structured Interviews so Rarely Used in Personnel Selection? Journal of Applied Psychology, Vol.87, No.1, P 176
- Borucke, M.; Moore, D.; Cranston, G.; Gracey, K.; Katsunori, I.; Larson, J.; Lazarus, E.; Morales, J.C.M.; Wackernagel, M.; Galli A. (2013), Accounting for demand and supply of the biosphere’s regenerative capacity: The National Footprint Accounts’ underlying methodology and framework. Ecol. Indic. 24, 518–533
- Cole, V. and Sinclair, J.A. (2002) Measuring the Ecological Footprint of a Himalayan Tourist Center. Mountain Research and Development 22(2): 132-141.
- Costanza, R. (2000) The Dynamics of the Ecological Footprint Concept. Ecological Economics 32(3): 341-345.
- De Vaus, DA. (2001). What is Research Design. SAGE Publication. London. Thousand Osks, New Delhi.
- Frey, LR& Botan, CH. (2000). Investigating Communication: An Introduction to Research Method.
- Global Footprint Network (2019) Glossary. In: Glob. Footpr. Netw. https://www.footprintnetwork.org/resources/glossary/#
- Holland L. (2003). Can the Principle of the Ecological Footprint be Applied to Measure the Environmental Sustainability of Business? Corporate Social Responsibility and Environmental Management, 10, 224-232.
- Hunter, C. (2002) Sustainable Tourism and the Touristic Ecological Footprint. Environment, Development and Sustainability 4: 7-20.
- Hunter, C., Shaw, J. (2007). The ecological footprint as a key indicator of sustainable tourism. Tourism Management, 28, 46-57.
- Johnsen,RB & Onwuegbuzie,AJ & Turner,LA. (2007). Toward a Definition of Mixed Method Research. Journal of Mixed Method Research, Vol.1, No.2, PP.112-133.
- Kisi, N. (2019). A Strategic Approach to Sustainable Tourism Development Using the A’WOT Hybrid Method:A Case Study of Zonguldak, Turkey. Sustainability, 11, 964.
- Kitzes, J.; Galli, A.; Bagliani, M.; Barrett, J.; Dige, G.; Ede, S.; Erb, K.; Giljum, S.; Haberl, H.; Hails, C.; Jolia Ferrier, L.; et al.(2009), A research agenda for improving national Ecological Footprint accounts. Ecol. Econ. 68, 1991–2007
- Lathem,B. (2007). Quantitative Research Method.ENGL5377.
- Mancini, M., Evans, M., Iha, K., Danelutti, C., and Galli, A. (2018). Assessing the Ecological Footprint of ecotourism packages: A methodological proposition. Resources, 7(2), 38.
- McNamara,C. (1999).General Guidelines for Conducting Interviews. Minnesota University.
- Mrabet Z, AlSamara M, Hezam Jarallah S (2017) The impact of economic development on environmental degradation in Qatar. Environ Ecol Stat 24:7–38.
- Rees WE (1992) Ecological footprints and appropriated carrying capacity: what urban economics leaves out. Environ Urban 4:121–130.
- Sala, V. C. (2008). Ecological footprint: a way to assess the impact of tourists’ choices at the local scale. WIT Press, 115, 197.
- Senbal, M., McDaniels, T., Dowlatabadi, H. (2003). The ecological footprint: a non-monetary metric of human consumption applied to North America. Global Environmental Change, 13, 83-100.
- Shuxin Wang,, Yiyuan Hu,, Hong He,and Genxu Wang. (2017). Progress and Prospects for Tourism Footprint Research. Sustainability, 9(10), 1847.
- Wackernagel, M, Onisto L, Bello P, Linares AC, Falfan I S L, Garcia J M, Suarez A L and Guerrero G S (1999). National Natural Capital Accounting with the Ecological Footprint Concept. Ecological Economics. 29, pp 375-390.
- Wackernagel, M. and Rees, W. (1996) Our Ecological Footprint: Reducing Human Impact on the Earth. New Society Publishers: Gabriola Island, BC.
- Wackernagel, M., Dholakia, R., Deumling, D., and Richardson, D. (2002). Ecological Footprint Household Evaluation Spreadsheet v.2.0. Retrieved February 15th, 2002, from: http://www.rprogress.org.
- Wackernagel, M., Onisto, L.Bello, P., Callejas Linares, A., López Falfán, I.S., Méndez García, J., Suárez Guerrero, A.I., Suarez Guerrero, G.S (1999) National natural capital accounting with the ecological footprint concept. Ecological Economics 29: 375-390.
- Wackernagel, M., Yount, J. D. (2000). Footprints for sustainability: The next steps. Environment, Development and Sustainability, 2, 21-42.
- Wackernagel, M.; Onisto, L.; Bello, P.; Linares, A.C.; Falfán, I.S.L.; Garcıa, J.M.; Guerrero, M.G.S. National natural capital accounting with the ecological footprint concept. Ecol. Econ. 1999, 29, 375–390.
- Wackernagel, M.; Rees, W.E. Our Ecological Footprint: Reducing Human Impact on the Earth; (1996) New Society Publishers: Gabriola Island, BC, Canada.
- Wackernagel, Mathis, William Rees (1996), Our Ecological Footprint: Reducing Human Impact on the Earth. Gabriola Island, B.C: New Society Publishers.
- World Wildlife Fund (2002). Holiday Footprinting: A Practical Guide for Responsible Tourism. World Wildlife Fund UK.
- World Wildlife Fund (2002a). Living Planet Report 2002. Retrieved October 12th, 2002, from: www.panda.org/downloads/general/LPR_2002.pd
- World Wildlife Fund (2006). Living Planet Report 2006. Retrieved Feb 14, 2006 from http://assets.panda.org/downloads/living_planet_report.pdf